Any questions and problems with the first seminar (simple genetic algorithm), can be discussed here.
V odpovědi na Martin Pilát
Re: Simple Genetic Algorithm / Jednoduchý genetický algoritmus
autor Štěpán Vomáčka -
Hi all,
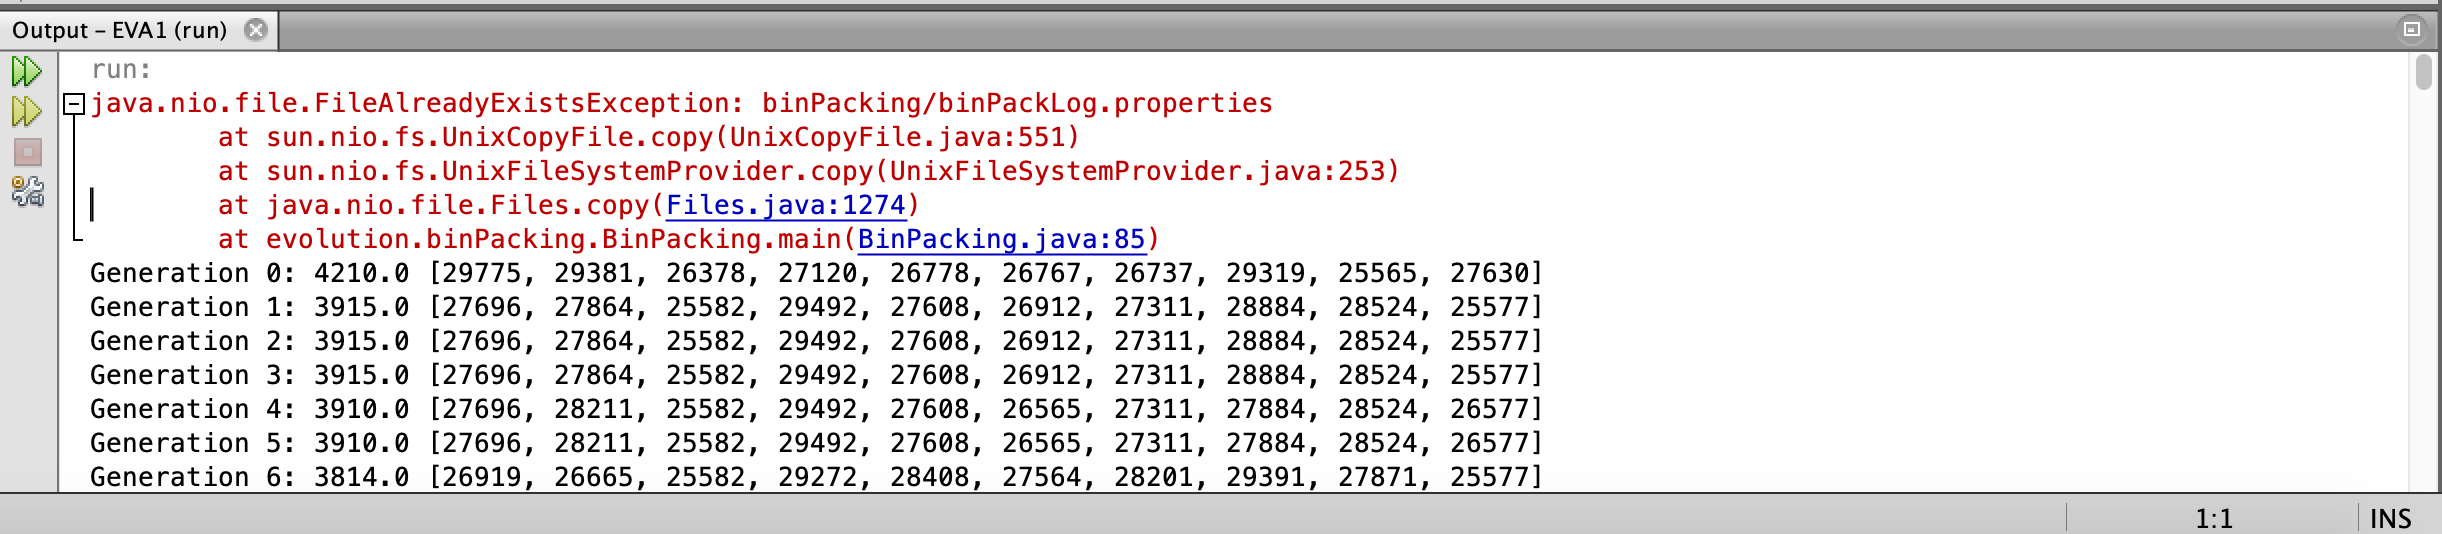
I'm totally not familiar with NetBeans, but i assume, there has to be setup, which will change the output from decimal to binary. Could you please help? I get the output in decimal (at least that's my assumption). Running version 8.2 on mac.
Thanks!
V odpovědi na Štěpán Vomáčka
Re: Simple Genetic Algorithm / Jednoduchý genetický algoritmus
autor Martin Pilát -
Hi,
the output looks OK, but you are running the sources for the next week seminar :). The one I was showing (and intended for this week) uses the evolution.sga.Main class as the main class. You should be able to right-click that class and select something as "Run".
Does it make sense? If you still have problems, let me know.
Have a nice day,
Martin
PS: If you want to remove the exception on the first line, download the new version of the source codes from GitHub, I fixed it on Wednesday (however, it is not critical, it just does not copy the properties to the output directory).
V odpovědi na Martin Pilát
Re: Simple Genetic Algorithm / Jednoduchý genetický algoritmus
autor Štěpán Vomáčka -
Oops (my bad), it works fine now!
Thanks!
V odpovědi na Martin Pilát
Re: Simple Genetic Algorithm / Jednoduchý genetický algoritmus
autor Petra Vysušilová -
Hi,
I'm not sure how to use logs. When I press "run", it will generate whole evolution of 20 generations ten times, right?
So when I am supposed to plot average and quartils, do I need to press "run" more times or just eventually increase number of runs and plot one result?
Thanks,
Péťa
V odpovědi na Petra Vysušilová
Re: Simple Genetic Algorithm / Jednoduchý genetický algoritmus
autor Martin Pilát -
Hi,
yes, if you click run, it will make 10 independent runs of the evolutionary algorithm. In the logs, you then have files with names ending in fitness.0 - fitness.9 and objective.0 to objective.9 (one for each run). These are the logs of the individual runs (first column is the fitness/objective of the best individual in the population, second column is the average fitness of the whole population, in both cases the value logged after each generation).
The logs also contain the files ending with .objective_stats and .fitness_stats that contain statistical information computed over the 10 runs.
So, it is enough to click "run" once and create the graph from the results. Of course, if you want to compare two or more different algorithms (or settings of the same algorithm), you need to run each of them once. In such a case, I recommend changing the log prefix in the properties file. Then, you can use the scripts to create the graph that compares the algorithms.
10 independent runs is enough for the needs of the seminar - you do not need to increase the number (of course, generally, for statistical evaluation, more is better - typically paper on evolutionary algorithms use around 20-50 runs).
If you have any more questions, let me know.
Have a nice weekend,
Martin